Plotly's Range Selector and Slider

Lets see an interesting feature of the plotly library. To make it more interesting, i chose a dataset which has information about the disk reads and wait times of a Oracle SQL query. In general, this type of information is used for performance analysis by the Oracle Engineers. Lets not get more into the technical details, rather sit back, relax and enjoy plotting.


Description:
We are creating a dictionary defining the layout for the Range Slider. What is a range slider? You will see that in a moment.

Description:
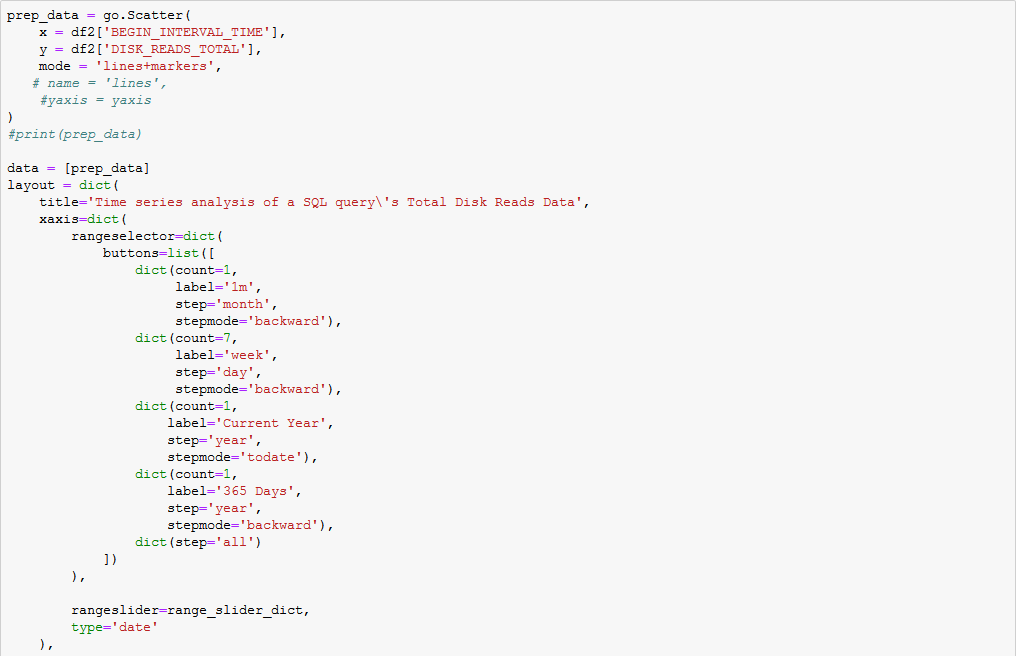
As we saw with geographical mapping, we need to do three things here:
- Get the data to plot
- Define the Layout
- Plot the graph
Getting the data is easy to understand. Lets focus on creating the 'layout'.
title: The title of the graph
xaxis: We are creating a dictionary for xaxis comprising of various features we want to incorporate in the graph associated with the xaxis.
rangeselector: the buttons we see at the top of the graph serve a purpose. For instance, clicking on "1m" will let us see the graph for a span of 1 month and so on. step, is used to define what functionality the button should server. It could be a month, year, hour, minute etc.
rangeslider: This is used to select a range of data per our need so that the focus on the graph shifts to the range we select using the bar. As you ca see, the dictionary we crated earlier is used here.
yaxis: Here we are using another dictionay to define various visible aspects of the yaxis.
autorange: define the values shown on the yaxis aligned accordingly with the actual data corresponding to the dataset.
linecolor: used to change the color of the line, if enabled, acting as the yaxis spin
showline: to enable yaxis spine
And you see many parameters related to the tick values as well, which are self descriptive. Check the documentation for more interesting info.

When you click on "1m", you will see the data captured for the last 30 days. You cal click "all" to rest the data back to the initial form, that is to include all the data.


Thanks for the comment Michale.
ReplyDelete