Is My Data Linear?

REGPLOT
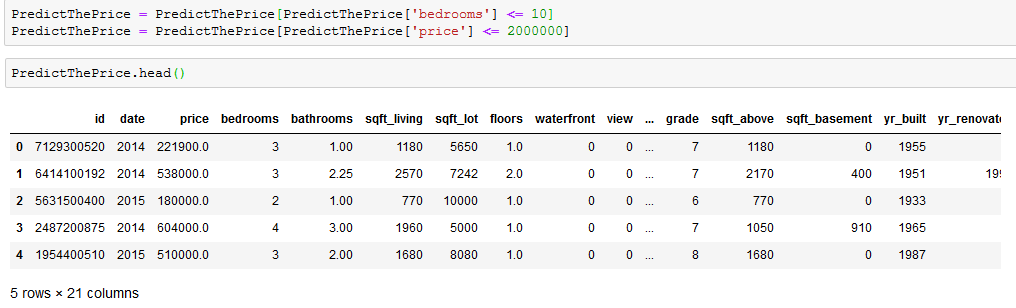
I have a dataset about the prices of houses across a various regions. Lets use this for plotting.

use regplot() to draw regression line that fits our dataset. Its a simple method taking values to be plottedalong x axis, y axis and the actual data set itself.

x_jitter: Is a clear distinction is to be made on how the data is distributed for each of the values on x axis. This option adds some noise to make the graph look distributed but has ZERO influence on calculating and plotting the regression line.

LMPLOT
lmplot is another way to plot a regression line along with confidence intervals.
Description:
Lets see another styling option offered by seaborn which uses "set_style". This can take: darkgrid, whitegrid, white, dark' as values. And the lmplot itself is simple. Use x and y to say which values are to be used along x and y axes and data parameter for the actual data to be used.

Suppose we want to know how 'waterfront' will influence the plot between bedrooms and price, we can use HUE for that.
size:
plt.subplot(figsize) option wont work with seaborn.lmplot(). To achieve similar results, we can use SIZE (defines the height )and ASPECT (aspect ratio of width and height) parameters.
Lets load another dataset to explore more about lmplot. as we've already seen, load_dataset() is used to pre-shipped data sets of seaborn.

 Description:
Everything looks the same as earlier except the new parameter:
row:
This is used to introduce another parameter for analysis. As we used row=time, 2 separate plots are drawn, each for 2 different time values.

This is used to introduce one more parameter into the analysis. Confused? Lets understand the entire picture.
x=total_bill, y=tip, hue=sex, row=time, column=smoker implies"
What is the total bill and the corresponding tips given by each customer classified as either male or female, whether they smoke or not and if it was done during the lunch time or the dinner time.

Is a parameter used to increase the DEGEREE of the line equation. For instance, order=2 refers to the polynomial line equation of degree 2. (Brush the math skills to understand what it means, for now lets say ax^2 + bx + c =0 is the general equation)
 |
col_wrap:
As the name suggests, this is used as a wrapping parameter. Depending on the value assigned, the number of graphs plotted in each column are restricted to that number.
Comments
Post a Comment
Hey there, feel free to leave a comment.