Seaborn - Strip,Swarm & Violin Plots

Lets use an actual data set - Number of immigrants from various countries to Canada from 1980 to 2013.


We have processed the actual data set to cater our needs. The actual data set can be downloaded from:
https://ibm.box.com/shared/static/lw190pt9zpy5bd1ptyg2aw15awomz9pu.xlsx
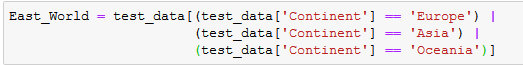
Lets create another data frame containing just the information related to Europe, Asia and Oceania.

Strip Plot

stripplot can be plotted using catplot() as well with the parameter kind = strip which is the default. If the markers are too cluttered, it can be adjusted to get more meaningful insight by adjusting the 'jitter' parameter.


Swarm Plot

Description:
As the name suggests, the plot looks like a Swarm of Bees, hence the name. Even this can be plotted using catplot() with kind as 'swarm'. We can add a hue element as well to introduce another feature in the analysis using 'hue' parameter.
This method ships with a variety of parameters such as changing the orientation from vertical to horizontal.

Violin Plot
This is an advanced plotting mechanism used by data scientists. It looks more like a box plot with a distribution over its sides.

Comments
Post a Comment
Hey there, feel free to leave a comment.